关注公众号不迷路:DumpStack
扫码加关注

目录
- 一、gcc编译选项:-g和-ggdb
- 二、gdb参数
- 三、gdb命令
- 3.1 help - gdb的帮助文件
- 3.2 apropos - 查看命令的缩写
- 3.3 file - 加载调试的文件
- 3.4 list - 列出源码
- 3.5 r/c/s/n/si/ni - 运行
- 3.6 disassemble - 反汇编指定的函数
- 3.7 p/print命令,查看变量/变量地址/数据类型/数据结构中的偏移/宏定义等
- 3.8 breacpoints - 断点设置
- 3.9 watch - 设置观察断点
- 3.10 cache - 设置捕捉断点
- 3.11 whatis - 查看变量的数据类型
- 3.12 ptype - 查看数据结构的类型
- 3.13 x - 查看内存
- 3.14 info - 查看寄存器和局部变量
- 3.14.1 info program - 查看程序是否在运行
- 3.14.2 info symbol - 查看指定地址对应的符号
- 3.14.2 info source - 显示当前所处的源文件
- 3.14.4 info sources - 打印当前elf文件所有源文件
- 3.14.5 info functions - 查看所有的函数符号
- 3.14.6 info functions regexp - 查看符合条件的函数
- 3.14.7 info variables - 查看所有的变量
- 3.14.8 info variables regexp - 查看所有符合条件的变量
- 3.14.9 info types - 查看所有的数据类型
- 3.14.10 info types regexp - 查看所有符合条件的数据类型
- 3.15 backtrace/frame - 查看调用栈信息
- 3.16 display - 显示关心的变量
- 3.17 dump - 将数组或者代码段导出到指定的文件
- 3.18 set logging - 将gdb的输出导出到指定的文件
- 3.19 set args - 向可执行程序传递参数
- 3.20 set var - 调试的过程中改变变量的值
- 3.21 cd/pwd - 切换/查看工作目录
- 3.22 指定gdb搜索源码的路径
- 3.23 shell - 执行shell命令
- 3.24 quit - 退出调试环境
- 3.25 使用"::"符号,指定要关注的变量或函数的所处位置
- 四、使用gdb调试正在运行的程序
- 关注公众号不迷路:DumpStack
参考文档:
https://blog.csdn.net/gatieme/article/details/51671430
https://blog.csdn.net/sunny_98_98/article/details/118786599
一、gcc编译选项:-g和-ggdb
要调试的程序在编译的时候需要加上-g选项,把调试信息加入可执行程序中,否则将看不见程序的函数名和变量名,代替它们的全是运行时的内存地址。
| gcc -g main.c -o mm gcc -gdb main.c -o mm |
要用gdb调试程序,必须在编译时加上-g和-ggdb选项,-g选项的作用是在可执行文件中加入源文件信息,但并不是将源文件嵌入可执行文件,所以在调试时必须保证gdb必须能找到源文件
-g和-ggdb都是令gcc生成调试信息,但是它们也是有区别的
| 选项 | 描述 |
| g | 该选项可以利用操作系统的"原生格式(native format)"生成调试信息,gdb可以直接利用这个信息,其它调试器也可以使用这个调试信息 |
| ggdb | 使gcc为gdb生成专用的更为丰富的调试信息,但此时就不能用其他的调试器来进行调试了,如ddx |
-g和-ggdb也是分级别的
| 选项 | 描述 |
| g1 | 级别1(-g1)不包含局部变量和与行号有关的调试信息,因此只能够用于回溯跟踪和堆栈转储之用。回溯跟踪指的是监视程序在运行过程中的函数调用历史,堆栈转储则是一种以原始的十六进制格式保存程序执行环境的方法,两者都是经常用到的调试手段 |
| g2 | 这是默认的级别,此时产生的调试信息包括扩展的符号表、行号、局部或外部变量信息 |
| g3 | 包含级别2中的所有调试信息,以及源代码中定义的宏 |
二、gdb参数
2.1 gdb的基本参数
| 选项 | 简写 | 描述 |
| -help | -h | 列出所有选项,并附简要说明 |
| -symbols=file | -s file | 读出文件(file)中的符号表 |
| -write | 无 | 开通(enable)往可执行文件和核心文件写的权限 |
| -exec=file | -e file | 在适当时候把File作为可执行的文件执行,来检测与core dump结合的数据 |
| -se File | 无 | 从指定文件中读取符号表信息,并把它用在可执行文件中 |
| -core File | -c File | 把File作为core dump来执行,调试时core dump的core文件 |
| -command=File | -x File | 从File中执行GDB命令 |
| -directory=Directory | -d Directory | 把Dicrctory加入源文件搜索的路径中,加入一个源文件的搜索路径,默认搜索路径是环境变量中PATH所定义的路径 |
| -nx | -n | 不从任何.gdbinit初始化文件中执行命令。通常情况下,这些文件中的命令是在所有命令选项和参数处理完后才执行 |
| -quiet | -q | "Quiet".不输入介绍和版权信息。这些信息输出在batch模式下也被关闭 |
| -batch | 运行batch模式。在处理完所有用'-x'选项指定的命令文件(还有'.gdbi-nit',如果没禁用)后退出,并返回状态码0.如果在命令文件中的命令被执行时发生错误,则退出,并返回状态码非0.batch模式对于运行GDB作为过滤器也许很有用,比如要从另一台电脑上下载并运行一个程序;为了让这些更有用,当在batch模式下运行时,消息:Program exited normally.(不论什么时候,一个程序在GDB控制下终止运行,这条消息都会正常发出.),将不会发出 | |
| -cd=Directory | 无 | 运行GDB,使用Directory作为它的工作目录,取代当前工作目录 |
| -fullname | -f | 当Emacs让GDB作为一个子进程运行时,设置这个选项.它告诉GDB每当一个堆栈结构(栈帧)显示出来(包括每次程序停止)就用标准的,认同的方式输出文件全名和行号.这里,认同的格式看起来像两个' 32'字符,紧跟文件名,行号和字符位置(由冒号,换行符分隔).Emacs同GDB的接口程序使用这两个' 32'字符作为一个符号为框架来显示源代码 |
| -b | 无 | BAUDRATE设置行速(波特率或bits/s).在远程调试中GDB在任何串行接口中使用的行速 |
| -tty=Device | 无 | 使用Device作为你程序运行的标准输入输出 |
2.2 运行环境相关
| 参数 | 描述 |
| path | 可设定程序的运行路径 |
| show paths | 查看程序的运行路径 |
| set environment varname [=value] | 设置环境变量。如:set env USER=hchen |
三、gdb命令
3.1 help - gdb的帮助文件
使用下面的命令得到的文件如下
| arm-explore-linux-gnueabi-gdb | tee help.txt help all |
输入help显示如下,gdb的命令很多,gdb将之分成许多种类。help命令只是列出gdb的命令种类
| (gdb) help List of classes of commands: aliases -- Aliases of other commands breakpoints -- Making program stop at certain points data -- Examining data files -- Specifying and examining files internals -- Maintenance commands obscure -- Obscure features running -- Running the program stack -- Examining the stack status -- Status inquiries support -- Support facilities tracepoints -- Tracing of program execution without stopping the program user-defined -- User-defined commands Type "help" followed by a class name for a list of commands in that class. Type "help all" for the list of all commands. Type "help" followed by command name for full documentation. Type "apropos word" to search for commands related to "word". Command name abbreviations are allowed if unambiguous. (gdb) |
可以使用下面三条命令,来进一步查询具体命令的帮助信息:
-
help <class name> :查看指定class下有哪些命令
-
help <command name> :查看指定command的使用说明
-
apropos xxx :查看所有命令描述中,带有xxx字符串的命令
还有一个方法,例如info有很多子命令,你输入info后直接tab键,会弹出有哪些可使用的子命令
| (gdb) info "info" must be followed by the name of an info command. List of info subcommands: info address -- Describe where symbol SYM is stored info all-registers -- List of all registers and their contents info args -- Argument variables of current stack frame info auto-load -- Print current status of auto-loaded files info auxv -- Display the inferior's auxiliary vector info bookmarks -- Status of user-settable bookmarks info breakpoints -- Status of specified breakpoints (all user-settable breakpoints if no argument) info classes -- All Objective-C classes info common -- Print out the values contained in a Fortran COMMON block info copying -- Conditions for redistributing copies of GDB info dcache -- Print information on the dcache performance info display -- Expressions to display when program stops info exceptions -- List all Ada exception names info extensions -- All filename extensions associated with a source language info files -- Names of targets and files being debugged info float -- Print the status of the floating point unit info frame -- All about selected stack frame info functions -- All function names info guile -- Prefix command for Guile info displays info handle -- What debugger does when program gets various signals info inferiors -- IDs of specified inferiors (all inferiors if no argument) info line -- Core addresses of the code for a source line info locals -- Local variables of current stack frame info macro -- Show the definition of MACRO info macros -- Show the definitions of all macros at LINESPEC info mem -- Memory region attributes info os -- Show OS data ARG info probes -- Show available static probes info proc -- Show /proc process information about any running process info program -- Execution status of the program info record -- Info record options info registers -- List of integer registers and their contents info scope -- List the variables local to a scope info selectors -- All Objective-C selectors info set -- Show all GDB settings info sharedlibrary -- Status of loaded shared object libraries info signals -- What debugger does when program gets various signals info skip -- Display the status of skips info source -- Information about the current source file info sources -- Source files in the program info stack -- Backtrace of the stack info static-tracepoint-markers -- List target static tracepoints markers info symbol -- Describe what symbol is at location ADDR info target -- Names of targets and files being debugged info tasks -- Provide information about all known Ada tasks info terminal -- Print inferior's saved terminal status info threads -- Display currently known threads info tracepoints -- Status of specified tracepoints (all tracepoints if no argument) ---Type <return> to continue, or q <return> to quit--- |
3.2 apropos - 查看命令的缩写
例如你想知道bt这个命令是什么命令的缩写,可以这样
| #第一步先查看bt命令的简要缩写 (gdb) help bt Print backtrace of all stack frames, or innermost COUNT frames. With a negative argument, print outermost -COUNT frames. Use of the 'full' qualifier also prints the values of the local variables. Use of the 'no-filters' qualifier prohibits frame filters from executing on this backtrace. #第二步使用apropos命令,并接上上面查到的命令的帮助信息中的一些关键字, #即可得到bt命令是哪个命令的缩写,从下面的打印可知,bt/backtrace/where #三条命令的含义是一样的 (gdb) apropos Print backtrace of all stack frames backtrace -- Print backtrace of all stack frames bt -- Print backtrace of all stack frames where -- Print backtrace of all stack frames |
3.3 file - 加载调试的文件
| gdb 程序名 # 指定要调试的程序 gdb 程序名 core # 指定要调试的程序和core文件,core是程序非法执行后,core dump后产生的文件 gdb 程序名 1234 # 以进程ID作为第二个参数,可以调式一个正在运行的进程, # 此时会把gdb附在进程1234之上 |
有两种方法加载要调试的文件
3.3.1 方法一:先启动gdb,再使用file命令加载
| [hupu@HUC ~/data/work/git/code/explore/kernel]$ arm-explore-linux-gnueabi-gdb GNU gdb (Crosstool-NG-1.23 Build by HP) 7.12.1 Copyright (C) 2017 Free Software Foundation, Inc. License GPLv3+: GNU GPL version 3 or later <http://gnu.org/licenses/gpl.html> This is free software: you are free to change and redistribute it. There is NO WARRANTY, to the extent permitted by law. Type "show copying" and "show warranty" for details. This GDB was configured as "--host=x86_64-build_pc-linux-gnu --target=arm-explore-linux-gnueabi". Type "show configuration" for configuration details. For bug reporting instructions, please see: <921889738@qq.com>. Find the GDB manual and other documentation resources online at: <http://www.gnu.org/software/gdb/documentation/>. For help, type "help". Type "apropos word" to search for commands related to "word". #使用file命令加载要调试的文件 (gdb) file vmlinux Reading symbols from vmlinux...done. #查看当前加载了哪些文件 (gdb) info files Symbols from "/home/hupu/data/work/git/code/explore/kernel/vmlinux". Local exec file: `/home/hupu/data/work/git/code/explore/kernel/vmlinux', file type elf32-littlearm. Entry point: 0x80008000 0x80008000 - 0x8000826c is .head.text 0x80100000 - 0x8073b180 is .text 0x8073b180 - 0x8073b19c is .fixup 0x80800000 - 0x8093b28a is .rodata 0x8093b290 - 0x80941638 is __bug_table 0x80941638 - 0x809487c0 is __ksymtab 0x809487c0 - 0x8094ec10 is __ksymtab_gpl 0x8094ec10 - 0x8096e339 is __ksymtab_strings 0x8096e33c - 0x8096f160 is __param 0x8096f160 - 0x80970000 is __modver 0x80970000 - 0x80970fb0 is __ex_table 0x80970fb0 - 0x809a2c28 is .ARM.unwind_idx 0x809a2c28 - 0x809ed3e8 is .ARM.unwind_tab 0x809ed3e8 - 0x809ed40c is .notes 0xffff0000 - 0xffff0020 is .vectors 0xffff1000 - 0xffff12ac is .stubs 0x80a002e0 - 0x80a41abc is .init.text 0x80a41abc - 0x80a43694 is .exit.text 0x80a43694 - 0x80a43764 is .init.arch.info 0x80a43764 - 0x80a43774 is .init.tagtable 0x80a43774 - 0x80a4f91c is .init.smpalt 0x80a4f91c - 0x80a4ff64 is .init.pv_table 0x80a50000 - 0x81074604 is .init.data 0x81075000 - 0x8107bbcc is .data..percpu 0x81100000 - 0x81199d80 is .data 0x8119a000 - 0x8119b000 is .data..page_aligned 0x8119b000 - 0x811c7880 is .bss (gdb) |
3.3.2 方法二,在启动的时候直接加载文件
| [hupu@HUC ~/data/work/git/code/explore/kernel]$ arm-explore-linux-gnueabi-gdb vmlinux GNU gdb (Crosstool-NG-1.23 Build by HP) 7.12.1 Copyright (C) 2017 Free Software Foundation, Inc. License GPLv3+: GNU GPL version 3 or later <http://gnu.org/licenses/gpl.html> This is free software: you are free to change and redistribute it. There is NO WARRANTY, to the extent permitted by law. Type "show copying" and "show warranty" for details. This GDB was configured as "--host=x86_64-build_pc-linux-gnu --target=arm-explore-linux-gnueabi". Type "show configuration" for configuration details. For bug reporting instructions, please see: <921889738@qq.com>. Find the GDB manual and other documentation resources online at: <http://www.gnu.org/software/gdb/documentation/>. For help, type "help". Type "apropos word" to search for commands related to "word"... Reading symbols from vmlinux...done. #查看已经加载的文件 (gdb) info files Symbols from "/home/hupu/data/work/git/code/explore/kernel/vmlinux". Local exec file: `/home/hupu/data/work/git/code/explore/kernel/vmlinux', file type elf32-littlearm. Entry point: 0x80008000 0x80008000 - 0x8000826c is .head.text 0x80100000 - 0x8073b180 is .text 0x8073b180 - 0x8073b19c is .fixup 0x80800000 - 0x8093b28a is .rodata 0x8093b290 - 0x80941638 is __bug_table 0x80941638 - 0x809487c0 is __ksymtab 0x809487c0 - 0x8094ec10 is __ksymtab_gpl 0x8094ec10 - 0x8096e339 is __ksymtab_strings 0x8096e33c - 0x8096f160 is __param 0x8096f160 - 0x80970000 is __modver 0x80970000 - 0x80970fb0 is __ex_table 0x80970fb0 - 0x809a2c28 is .ARM.unwind_idx 0x809a2c28 - 0x809ed3e8 is .ARM.unwind_tab 0x809ed3e8 - 0x809ed40c is .notes 0xffff0000 - 0xffff0020 is .vectors 0xffff1000 - 0xffff12ac is .stubs 0x80a002e0 - 0x80a41abc is .init.text 0x80a41abc - 0x80a43694 is .exit.text 0x80a43694 - 0x80a43764 is .init.arch.info 0x80a43764 - 0x80a43774 is .init.tagtable 0x80a43774 - 0x80a4f91c is .init.smpalt 0x80a4f91c - 0x80a4ff64 is .init.pv_table 0x80a50000 - 0x81074604 is .init.data 0x81075000 - 0x8107bbcc is .data..percpu 0x81100000 - 0x81199d80 is .data 0x8119a000 - 0x8119b000 is .data..page_aligned 0x8119b000 - 0x811c7880 is .bss (gdb) |
3.4 list - 列出源码
当以gdb方式启动gdb后,gdb会在PATH路径和当前目录中搜索的源文件。如要确认gdb是否读到源文件,可使用l或list命令,看看gdb是否能列出源代码,list默认每次显示10行
| list # 查看源码,默认列出10行 list 123 # 查看第123周围的10行代码 list - # 查看上一个list所查看的代码 list 123, 456 # 查看从123行~456行之间的代码 list funcname # 查看funcname函数周围的10行代码 list file.c:123 # 查看file.c的第123行周围的10行代码 list file.c:funcname # 查看file.c文件中的funcname函数周围的10行代码 list *0x802e5f44 # 显示指定地址处对应的代码 |
3.5 r/c/s/n/si/ni - 运行
| r/run #全速运行,直至下一个断点 c/continue [N] #继续运行,直至下一个断点,如果接了参数N,则表示忽略N次断点 s/step [N] #单步运行,会进入子函数,即step into,若加N,则表示连续执行N条指令 n/next [N] #下一步,或者连续执行N步,不会进入子函数,即step over si/stepi [N] #单步运行,或者连续执行N步,针对汇编 ni/nexti [N] #下一步,或者连续执行N步,针对汇编 finish #继续执行,直到当前函数返回 u/util #当厌倦了在一个循环体内单步跟踪时,这个命令可以运行程序直到退出循环体 return #强制从当前函数返回 restart #重来 |
3.6 disassemble - 反汇编指定的函数
命令格式如下:
| #反汇编指定的函数 disassemble /s func_name #有的函数可能会存在重名,下面命令反汇编指定文件中的函数 disassemble /s '<file_path>'::func_name #对指定的地址空间内的代码进行反汇编 disassemble /s 0x80160d60, 0x80170d78 #对知道地址后面的代码进行反汇编 disassemble /s 0x80160d60 |
示例如下:
| (gdb) disassemble /s '/home/hupu/data/work/git/code/explore/kernel/kernel/sched/cpufreq_schedutil.c'::sugov_init Dump of assembler code for function sugov_init: kernel/sched/cpufreq_schedutil.c: 409 { 0x8016aca8 <+0>: mov r12, sp 0x8016acac <+4>: push {r4, r5, r6, r7, r8, r11, r12, lr, pc} 0x8016acb0 <+8>: sub r11, r12, #4 0x8016acb4 <+12>: sub sp, sp, #12 0x8016acb8 <+16>: push {lr} ; (str lr, [sp, #-4]!) 0x8016acbc <+20>: bl 0x80110394 <__gnu_mcount_nc> 410 struct sugov_policy *sg_policy; 411 struct sugov_tunables *tunables; 412 unsigned int lat; 413 int ret = 0; 414 415 /* State should be equivalent to EXIT */ 416 if (policy->governor_data) 0x8016acc0 <+24>: ldr r6, [r0, #68] ; 0x44 409 { 0x8016acc4 <+28>: mov r5, r0 410 struct sugov_policy *sg_policy; 411 struct sugov_tunables *tunables; 412 unsigned int lat; 413 int ret = 0; 414 415 /* State should be equivalent to EXIT */ 416 if (policy->governor_data) 0x8016acc8 <+32>: cmp r6, #0 417 return -EBUSY; 0x8016accc <+36>: mvnne r8, #15 416 if (policy->governor_data) 0x8016acd0 <+40>: bne 0x8016adb8 <sugov_init+272> |
3.7 p/print命令,查看变量/变量地址/数据类型/数据结构中的偏移/宏定义等
| [hupu@HUC ~/data/work/git/code/explore/kernel]$ arm-explore-linux-gnueabi-gdb vmlinux GNU gdb (Crosstool-NG-1.23 Build by HP) 7.12.1 Copyright (C) 2017 Free Software Foundation, Inc. License GPLv3+: GNU GPL version 3 or later <http://gnu.org/licenses/gpl.html> This is free software: you are free to change and redistribute it. There is NO WARRANTY, to the extent permitted by law. Type "show copying" and "show warranty" for details. This GDB was configured as "--host=x86_64-build_pc-linux-gnu --target=arm-explore-linux-gnueabi". Type "show configuration" for configuration details. For bug reporting instructions, please see: <921889738@qq.com>. Find the GDB manual and other documentation resources online at: <http://www.gnu.org/software/gdb/documentation/>. For help, type "help". Type "apropos word" to search for commands related to "word"... Reading symbols from vmlinux...done. #查看数据类型的大小 (gdb) p sizeof(int) $5 = 4 (gdb) p sizeof(long) $6 = 4 (gdb) p sizeof(struct task_struct) $1 = 1472 #查看变量的数据类型 (gdb) whatis fair_sched_class type = const struct sched_class #查看数据结构中某个成员的偏移 (gdb) p &((struct task_struct *)0)->prio $4 = (int *) 0x30 #按照指定的机制或者格式显示,具体可使用那些机制和合适,可通过"help x"命令查看 (gdb) p 0x123 $2 = 291 (gdb) p /x 1234 $3 = 0x4d2 #直接查看某个全局变量的值,真的好牛逼 (gdb) p fair_sched_class $8 = {next = 0x80803fb4 <idle_sched_class>, enqueue_task = 0x801590cc <enqueue_task_fair>, dequeue_task = 0x8015cdac <dequeue_task_fair>, yield_task = 0x8015add8 <yield_task_fair>, yield_to_task = 0x8015af08 <yield_to_task_fair>, check_preempt_curr = 0x8015c8c8 <check_preempt_wakeup>, pick_next_task = 0x80160d60 <pick_next_task_fair>, put_prev_task = 0x80158290 <put_prev_task_fair>, select_task_rq = 0x80157800 <select_task_rq_fair>, migrate_task_rq = 0x8015f708 <migrate_task_rq_fair>, task_woken = 0x0, set_cpus_allowed = 0x8014f3d8 <set_cpus_allowed_common>, rq_online = 0x8015cbd8 <rq_online_fair>, rq_offline = 0x80155f0c <rq_offline_fair>, set_curr_task = 0x801575d8 <set_curr_task_fair>, task_tick = 0x8015babc <task_tick_fair>, task_fork = 0x8015cbf4 <task_fork_fair>, task_dead = 0x8015f6e8 <task_dead_fair>, switched_from = 0x8015dc44 <switched_from_fair>, switched_to = 0x8015af94 <switched_to_fair>, prio_changed = 0x8015af44 <prio_changed_fair>, get_rr_interval = 0x801563b4 <get_rr_interval_fair>, update_curr = 0x80156278 <update_curr_fair>} #当然也可以查看全局变量的指定成员 (gdb) p fair_sched_class.pick_next_task $19 = (struct task_struct *(*)(struct rq *, struct task_struct *, struct pin_cookie)) 0x80160d60 <pick_next_task_fair> #查看数组的地址 (gdb) p &crc16_table $17 = (const u16 (*)[256]) 0x80831e90 <crc16_table> #查看数组成员 (gdb) p crc16_table $16 = {0, 49345, 49537, 320, 49921, 960, 640, 49729, 50689, 1728, 1920, 51009, 1280, 50625, 50305, 1088, 52225, 3264, 3456, 52545, 3840, 53185, 52865, 3648, 2560, 51905, 52097, 2880, 51457, 2496, 2176, 51265, 55297, 6336, 6528, 55617, 6912, 56257, 55937, 6720, 7680, 57025, 57217, 8000, 56577, 7616, 7296, 56385, 5120, 54465, 54657, 5440, 55041, 6080, 5760, 54849, 53761, 4800, 4992, 54081, 4352, 53697, 53377, 4160, 61441, 12480, 12672, 61761, 13056, 62401, 62081, 12864, 13824, 63169, 63361, 14144, 62721, 13760, 13440, 62529, 15360, 64705, 64897, 15680, 65281, 16320, 16000, 65089, 64001, 15040, 15232, 64321, 14592, 63937, 63617, 14400, 10240, 59585, 59777, 10560, 60161, 11200, 10880, 59969, 60929, 11968, 12160, 61249, 11520, 60865, 60545, 11328, 58369, 9408, 9600, 58689, 9984, 59329, 59009, 9792, 8704, 58049, 58241, 9024, 57601, 8640, 8320, 57409, 40961, 24768, 24960, 41281, 25344, 41921, 41601, 25152, 26112, 42689, 42881, 26432, 42241, 26048, 25728, 42049, 27648, 44225, 44417, 27968, 44801, 28608, 28288, 44609, 43521, 27328, 27520, 43841, 26880, 43457, 43137, 26688, 30720, 47297, 47489, 31040, 47873, 31680, 31360, 47681, 48641, 32448, 32640, 48961, 32000, 48577, 48257, 31808, 46081, 29888, 30080, 46401, 30464, 47041, 46721, 30272, 29184, 45761, 45953, 29504, 45313, 29120, 28800, 45121, 20480, 37057, 37249, 20800, 37633, 21440, 21120, 37441...} #查看数组的指定成员 (gdb) p crc16_table[3] $22 = 320 #查看数组前3个成员 (gdb) p crc16_table[0]@3 $25 = {0, 49345, 49537} (gdb) p crc16_table@3 # 有的工具链中可能会打印sizeof(crc16_table)*3这么多的数据 $8 = {0, 0, 49345} (gdb) p /x crc16_table@3 $9 = {0x0, 0x0, 0xc0c1} (gdb) #调用函数,这里报错是因为我还没有进程运行起来 (gdb) p div64_s64(2, 3) You can't do that without a process to debug. #如果你的程序是正常在运行的话,则可以调用里面的函数 (gdb) p gdbdebug_add(2, 3) $1 = 5 #打印函数相关信息,包括函数类型,地址 (gdb) p version_proc_show $4 = {int (struct seq_file *, void *)} 0x802e5f44 <version_proc_show> |
| p/print p aaa # 查看变量aaa的名称 p func::aaa # 查看在指定函数中的局部变量aaa #注:要想在gdb中能够查看宏的值,编译时必须加上-gdwarf-2 -g3参数 p MACRO_NAME # 查看宏的值 info macro MACRO_NAME # 查看宏的定义 macro expand MACRO_NAME # 查看宏是怎么被展开的 |
3.8 breacpoints - 断点设置
| break linename #在指定行添加断点 break filename:linenum #在指定文件的指定行设置断点 break funcname #在指定函数处添加断点 break filename:funcname #在指定文件的指定函数处设置断点 break *funcname #将断点设置在"由编译器生成的prolog代码处" break *address #在指定地址处添加断点,例如*0x804835c break +offset #在当前行前面offset行添加断点 break -offset #在当前行后面offset行添加断点 break 10 if i == 8 #条件断点,当i等于8的时候,停在第10行 clear #删除所有断点 clear 1234 #删除行号为1234处的断点 delete 7 #删除编号为7的断点 delete 7-10 #删除编号为7,8,9,10的断点 disable 7 #禁用编号为7的断点 disable 7-10 #禁用编号为7,8,9,10的断点 enable 7 #重新使能7号断点 enable 7-10 #重新使能编号为7,8,9,10的断点 enable 7 once #只使能一次,当程序停止后,该断点自动disable enable 7 delete #只使能一次,当程序停止后,该断点自动被删除 ignore id count #忽略某个断点的次数,例如ignore 4 23 #表示忽略断点4的23次运行,在第24次的时候中断 info breakpoints #查看所有的断点 ctrl+c #在当前位置停止执行正在执行的程序,断点在当前行 |
此外,还有一个很强大的功能,即为断点设置运行命令,即当触发断点的时候,我们可以执行一些命令或自定义的程序,这很有利于自动化测试
为指定的断点号bnum设置命令列表的方法如下,如果不接bnum,则表示为所有的断点设置命令,当程序被该断点停住时,gdb会依次运行命令列表中的命令
| commands [bnum] ... command-list ... end |
例如下面表示将断点设置在函数foo中,断点条件是x>0,如果程序被断住后,也就是一旦x的值在foo函数中大于0,gdb会自动打印出x的值,并继续运行程序。
如果要清除断点上的命令序列,那么只要简单地执行一下commands命令,并直接在输入end就行了。
| break foo if x>0 commands printf "x is %d/n",x continue end |
3.9 watch - 设置观察断点
当变量的值发生变化,或者读/写变量的时候,触发断点
| wacth <expr> # 只要变量或表达式的值发生变化,就触发断点 rwatch <expr> # 只有在读变量或表达式的时候,才触发断点 awatch <expr> # 只有在写变量或表达式的时候,才触发断点 info watchpoints # 查看有哪些观察断点 delete watchpoints # 删除观察点 |
3.10 cache - 设置捕捉断点
可设置捕捉点来补捉程序运行时的一些事件。如载入共享库(动态链接库)或是C++的异常。设置捕捉点的格式为:
| 参数 | 描述 |
| catch | 当event发生时,停住程序 |
| tcatch | 只设置一次捕捉点,当程序停住以后,应点被自动删除 |
event可以是下面的内容
| 参数 | 描述 |
| throw | 一个C++抛出的异常 (throw为关键字) |
| catch | 一个C++捕捉到的异常 (catch为关键字) |
| exec | 调用系统调用exec时(exec为关键字,目前此功能只在HP-UX下有用) |
| fork | 调用系统调用fork时(fork为关键字,目前此功能只在HP-UX下有用) |
| vfork | 调用系统调用vfork时(vfork为关键字,目前此功能只在HP-UX下有) |
| load 或 load | 载入共享库(动态链接库)时 (load为关键字,目前此功能只在HP-UX下有用) |
| unload 或 unload | 卸载共享库(动态链接库)时 (unload为关键字,目前此功能只在HP-UX下有用) |
3.11 whatis - 查看变量的数据类型
| #查看变量的数据类型 (gdb) whatis fair_sched_class type = const struct sched_class |
3.12 ptype - 查看数据结构的类型
| ptype struct xxx #查看指定的数据类型 ptype varname #查看某个变量的数据类型 ptype funcname #查看指定函数的数据类型 |
3.13 x - 查看内存
| x /d addr x /x addr # 已十六进制显示指定内存的中的数据 x /3bx crc16_table # 查看从crc16_table开始之后的2个byte的数据,以16进制显示 x /6wx crc16_table # 查看从crc16_table开始之后的2个word的数据,以16进制显示 x /8wd crc16_table # 查看从crc16_table开始之后的8个word的数据,以10进制显示 |
3.14 info - 查看寄存器和局部变量
| i/info # 显示各类详细 info registers # 查看当前寄存器的值 info all-registers # 查看所有寄存器 info registers $pc # 查看pc寄存器的值 info registers $r14 # 查看r14寄存器的值 info locals # 查看有哪些局部变量,并查看他们的值 info program # 查看当前程序是否在运行,及运行状态 info symbol xxx # 查看执行地址对应的符号 |
3.14.1 info program - 查看程序是否在运行
| info program #查看当前程序是否在运行,及运行状态 |
3.14.2 info symbol - 查看指定地址对应的符号
| (gdb) p kernel_init $1 = {int (void *)} 0xffff000011865720 <kernel_init> (gdb) info symbol 0xffff000011865720 kernel_init + 8 in section .text |
3.14.2 info source - 显示当前所处的源文件
显示当前源文件的名称,即包含当前执行点的函数的源文件,以及编写它的语言
| (gdb) info source No current source file. |
3.14.4 info sources - 打印当前elf文件所有源文件
打印程序中包含调试信息的所有源文件的名称,分为两个列表:已读取符号的文件和需要时将读取符号的文件,下面示例中已经读取的符号文件列表为空
| (gdb) info sources Source files for which symbols have been read in: Source files for which symbols will be read in on demand: /home/hupu/data/work/opensource/runninglinuxkernel_5.0/include/linux/rcupdate.h, /home/hupu/data/work/opensource/runninglinuxkernel_5.0/include/asm-generic/bitops/builtin-__ffs.h, /home/hupu/data/work/opensource/runninglinuxkernel_5.0/arch/arm64/include/asm/preempt.h, /home/hupu/data/work/opensource/runninglinuxkernel_5.0/arch/arm64/include/asm/current.h, /home/hupu/data/work/opensource/runninglinuxkernel_5.0/include/linux/bottom_half.h, /home/hupu/data/work/opensource/runninglinuxkernel_5.0/arch/arm64/include/asm/atomic_lse.h, ... |
3.14.5 info functions - 查看所有的函数符号
打印所有定义函数的名称和数据类型
| (gdb) info functions All defined functions: File ./arch/arm64/include/asm/arch_timer.h: 151: static u64 arch_counter_get_cntpct(void); 157: static u64 arch_counter_get_cntvct(void); File ./arch/arm64/include/asm/atomic_ll_sc.h: 287: u16 __ll_sc___cmpxchg_case_16(volatile void *, unsigned long, u16); 288: u32 __ll_sc___cmpxchg_case_32(volatile void *, unsigned long, u32); 289: u64 __ll_sc___cmpxchg_case_64(volatile void *, unsigned long, u64); 286: u8 __ll_sc___cmpxchg_case_8(volatile void *, unsigned long, u8); 291: u16 __ll_sc___cmpxchg_case_acq_16(volatile void *, unsigned long, u16); 292: u32 __ll_sc___cmpxchg_case_acq_32(volatile void *, unsigned long, u32); 293: u64 __ll_sc___cmpxchg_case_acq_64(volatile void *, unsigned long, u64); 290: u8 __ll_sc___cmpxchg_case_acq_8(volatile void *, unsigned long, u8); 299: u16 __ll_sc___cmpxchg_case_mb_16(volatile void *, unsigned long, u16); 300: u32 __ll_sc___cmpxchg_case_mb_32(volatile void *, unsigned long, u32); 301: u64 __ll_sc___cmpxchg_case_mb_64(volatile void *, unsigned long, u64); 298: u8 __ll_sc___cmpxchg_case_mb_8(volatile void *, unsigned long, u8); 295: u16 __ll_sc___cmpxchg_case_rel_16(volatile void *, unsigned long, u16); 296: u32 __ll_sc___cmpxchg_case_rel_32(volatile void *, unsigned long, u32); 297: u64 __ll_sc___cmpxchg_case_rel_64(volatile void *, unsigned long, u64); 294: u8 __ll_sc___cmpxchg_case_rel_8(volatile void *, unsigned long, u8); ... |
3.14.6 info functions regexp - 查看符合条件的函数
打印出所有符合条件的函数名或数据类型
regexp是一个正则表达式,info functions fair表示查找所有包含fair关键字的函数名,info functions fair表示找出所有已fair开头的函数名
| (gdb) info functions fair All functions matching regular expression "fair": File drivers/thermal/fair_share.c: 133: int thermal_gov_fair_share_register(void); 138: void thermal_gov_fair_share_unregister(void); 90: static int fair_share_throttle(struct thermal_zone_device *, int); File kernel/sched/fair.c: 10323: int alloc_fair_sched_group(struct task_group *, struct task_group *); 10306: void free_fair_sched_group(struct task_group *); 10582: void init_sched_fair_class(void); 10364: void online_fair_sched_group(struct task_group *); 3085: void set_task_rq_fair(struct sched_entity *, struct cfs_rq *, struct cfs_rq *); 10382: void unregister_fair_sched_group(struct task_group *); 5194: static void dequeue_task_fair(struct rq *, struct task_struct *, int); 5112: static void enqueue_task_fair(struct rq *, struct task_struct *, int); ... (gdb) info functions ^fair All functions matching regular expression "^fair": File drivers/thermal/fair_share.c: 90: static int fair_share_throttle(struct thermal_zone_device *, int); ... |
3.14.7 info variables - 查看所有的变量
查看所有的全局变量,不包括局部变量
| (gdb) info variables All defined variables: File drivers/devfreq/governor_performance.c: 64: static const char __UNIQUE_ID_license10[12]; 41: static struct devfreq_governor devfreq_performance; File drivers/devfreq/governor_performance.mod.c: 11: struct module __this_module; 21: static const char __UNIQUE_ID_intree12[9]; 9: static const char __UNIQUE_ID_name11[26]; 8: static const char __UNIQUE_ID_vermagic10[51]; 27: static const struct modversion_info ____versions[7]; 39: static const char __module_depends[9]; 6: static const struct { struct elf32_note _nhdr; unsigned char _name[6]; char _desc[15]; } _note_6; Non-debugging symbols: 0x0000000000000000 __func__.19075 (gdb) |
3.14.8 info variables regexp - 查看所有符合条件的变量
打印出所有符合条件的变量名或数据类型
regexp是一个正则表达式,info variables fair表示查找所有包含fair关键字的变量名,info variables fair表示找出所有已fair开头的变量名
| (gdb) info variables performance All variables matching regular expression "performance": File drivers/devfreq/governor_performance.c: 41: static struct devfreq_governor devfreq_performance; (gdb) |
3.14.9 info types - 查看所有的数据类型
| (gdb) info types All defined types: File ./arch/arm64/include/asm/arch_timer.h: 41: enum arch_timer_erratum_match_type; 49: struct arch_timer_erratum_workaround; File ./arch/arm64/include/asm/cpufeature.h: 65: struct arm64_ftr_bits; 80: struct arm64_ftr_reg; 47: enum ftr_type; File ./arch/arm64/include/asm/device.h: 19: struct dev_archdata; File ./arch/arm64/include/asm/insn.h: 474: typedef bool (unsigned long) pstate_check_t; File ./arch/arm64/include/asm/module.h: 30: struct mod_arch_specific; 24: struct mod_plt_sec; 53: struct plt_entry; |
3.14.10 info types regexp - 查看所有符合条件的数据类型
下面示例查看所有数据类型中包含plt关键字的数据类型
| (gdb) info types plt All types matching regular expression "plt": File ./arch/arm64/include/asm/module.h: 24: struct mod_plt_sec; 53: struct plt_entry; (gdb) |
3.15 backtrace/frame - 查看调用栈信息
当程序被停住了,你需要做的第一件事就是查看程序是在哪里停住的。当你的程序调用了一个函数,函数的地址,函数参数,函数内的局部变量都会被压入"栈"(Stack)中。你可以用GDB命令来查看当前的栈中的信息
3.15.1 bt/backtrace/where - 查看函数调用关系,即调用栈
| (gdb) help bt Print backtrace of all stack frames, or innermost COUNT frames. With a negative argument, print outermost -COUNT frames. Use of the 'full' qualifier also prints the values of the local variables. Use of the 'no-filters' qualifier prohibits frame filters from executing on this backtrace. #从下面可以看出函数的调用栈信息:__libc_start_main --> main()--> func() #此外,bt命令也被用来观察当前代码运行到哪一行了 (gdb) bt #0 func (n=250) at tst.c:6 #1 0x08048524 in main (argc=1, argv=0xbffff674) at tst.c:30 #2 0x400409ed in __libc_start_main () from /lib/libc.so.6 backtrace <n> bt <n> n是一个正整数,表示只打印栈顶上n层的栈信息。 backtrace <-n> bt <-n> -n表一个负整数,表示只打印栈底下n层的栈信息。 如果你要查看某一层的信息,你需要在切换当前的栈,一般来说,程序停止时,最顶层的栈就是当前栈,如果你要查看栈下面层的详细信息,首先要做的是切换当前栈。 |
3.15.2 f/frame
| f/frame [N] # N为栈的层次,frame 0表示栈顶,frame 1表示栈的第二层 up [N] # 表示向栈的上面移动n层,可以不打n,表示向上移动一层 down [N] # 表示向栈的下面移动n层,可以不打n,表示向下移动一层 |
3.16 display - 显示关心的变量
每次中断或单步的时候都显示你关心的变量
| display # 设置程序中断后欲显示的数据及其格式。例如,如果希望程序中断后 # 可以看到即将被执行的下一条汇编指令,可以使用命令"display /i $pc" # 其中$pc代表当前汇编指令,/i 表示以十六进行显示。当需要关心汇编代码 # 时,此命令相当有用。 disable <var> # 每次单步运行时,显示变量名称 undispaly # 取消先前的display设置,编号从1开始递增。 |
3.17 dump - 将数组或者代码段导出到指定的文件
| [hupu@HUC ~/data/work/test/ex10]$ gdb test GNU gdb (Ubuntu 7.11.1-0ubuntu1~16.5) 7.11.1 Copyright (C) 2016 Free Software Foundation, Inc. License GPLv3+: GNU GPL version 3 or later <http://gnu.org/licenses/gpl.html> This is free software: you are free to change and redistribute it. There is NO WARRANTY, to the extent permitted by law. Type "show copying" and "show warranty" for details. This GDB was configured as "x86_64-linux-gnu". Type "show configuration" for configuration details. For bug reporting instructions, please see: <http://www.gnu.org/software/gdb/bugs/>. Find the GDB manual and other documentation resources online at: <http://www.gnu.org/software/gdb/documentation/>. For help, type "help". Type "apropos word" to search for commands related to "word"... Reading symbols from test...(no debugging symbols found)...done. (gdb) info files Symbols from "/home/hupu/data/work/test/ex10/test". Local exec file: `/home/hupu/data/work/test/ex10/test', file type elf64-x86-64. Entry point: 0x5a0 0x0000000000000238 - 0x0000000000000254 is .interp 0x0000000000000254 - 0x0000000000000274 is .note.ABI-tag 0x0000000000000274 - 0x0000000000000298 is .note.gnu.build-id 0x0000000000000298 - 0x00000000000002b4 is .gnu.hash 0x00000000000002b8 - 0x0000000000000378 is .dynsym 0x0000000000000378 - 0x0000000000000417 is .dynstr 0x0000000000000418 - 0x0000000000000428 is .gnu.version 0x0000000000000428 - 0x0000000000000458 is .gnu.version_r 0x0000000000000458 - 0x0000000000000518 is .rela.dyn 0x0000000000000518 - 0x0000000000000548 is .rela.plt 0x0000000000000548 - 0x000000000000055f is .init 0x0000000000000560 - 0x0000000000000590 is .plt 0x0000000000000590 - 0x0000000000000598 is .plt.got
0x00000000000007b4 - 0x00000000000007bd is .fini 0x00000000000007c0 - 0x00000000000007d3 is .rodata 0x00000000000007d4 - 0x0000000000000810 is .eh_frame_hdr 0x0000000000000810 - 0x0000000000000918 is .eh_frame 0x0000000000200db0 - 0x0000000000200db8 is .init_array 0x0000000000200db8 - 0x0000000000200dc0 is .fini_array 0x0000000000200dc0 - 0x0000000000200fb0 is .dynamic 0x0000000000200fb0 - 0x0000000000201000 is .got 0x0000000000201000 - 0x0000000000201010 is .data 0x0000000000201010 - 0x0000000000201018 is .bss (gdb) dump memory text.bin 0x00000000000005a0 0x00000000000007b2 (gdb) q [hupu@HUC ~/data/work/test/ex10]$ ls aaa.bin test test.c text.bin |
3.18 set logging - 将gdb的输出导出到指定的文件
方法一:适合临时向文件输出一些信息的情况
比如要用info functions输出所有函数,结果往往有一大坨,所以可以将之输出到文件。
| (gdb) set logging file <file name> # 设置输出文件的名称 (gdb) set logging on # 输入这个命令后,此后的调试信息将输出到指定文件 (gdb) info functions # 查看所有的函数 (gdb) thread apply all bt # 打印说有线程栈信息 (gdb) help all # 查看所有的帮助信息 (gdb) set logging off # 输入这个命令,关闭到指定文件的输出 |
方法二:适合整个gdb会话期间都重定向输出的情况
| gdb | tee aaa.log |
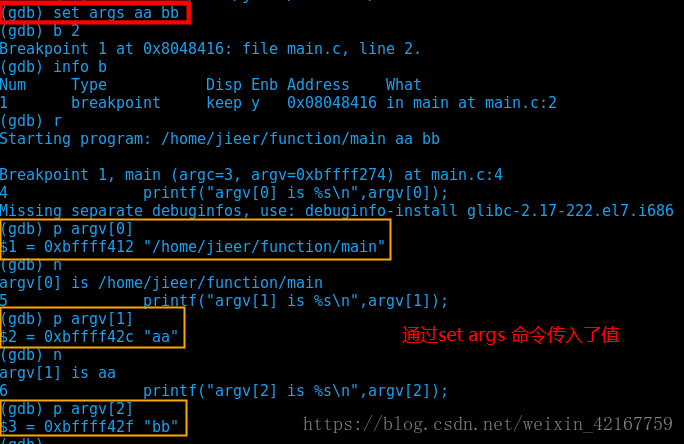
3.19 set args - 向可执行程序传递参数
| set args 10 20 30 40 50 # 设置参数 show args # 查看设置的参数 |
有的可执行程序在运行的时候可以传入一堆的参数,例如./test a b c d,下面举例说明,源代码如下:
| 1 #include <stdio.h> 2 int main(int argc, char **argv) 3 { 4 printf("argv[0] is %s\n",argv[0]); 5 printf("argv[1] is %s\n",argv[1]); 6 printf("argv[2] is %s\n",argv[2]); 7 return 0; 8 } |
编译为可执行文件:
| gcc -g main.c -o main |
下面使用gdb调试:
| gdb main |
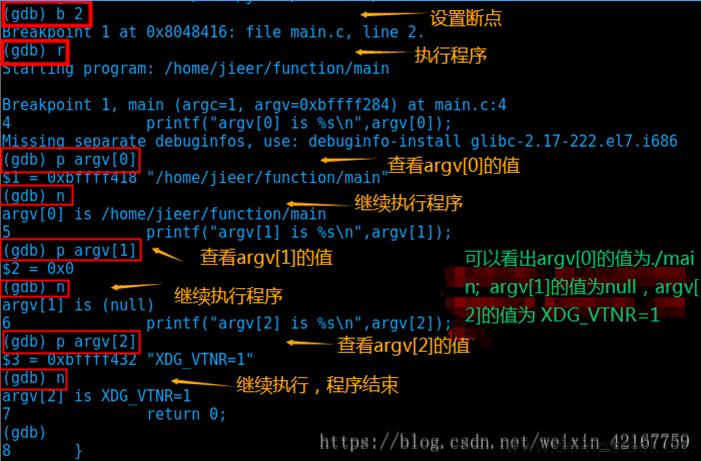

对于以上截图中显示所示,argv[2]的值被默认赋值为shell定义的一个变量,还未找到能说服自己的理由,欢迎留言。等同于:
| [root@jie function]# ./main argv[0] is ./main argv[1] is (null) argv[2] is XDG_VTNR=1 |
下面我们使用set args改变参数

等同于:
| [root@jie function]# ./main aa bb argv[0] is ./main argv[1] is aa argv[2] is bb |
关于设置运行参数,其实这也不是唯一途径,另一个方法同样能解决问题:
| (gdb) shell ./a.out a b argv[0] is ./a.out argv[1] is a argv[2] is b |
但是这时候就来不及打断点调试了,等于直接运行了,所以,其实是代替不了上边的那种运行方式的。
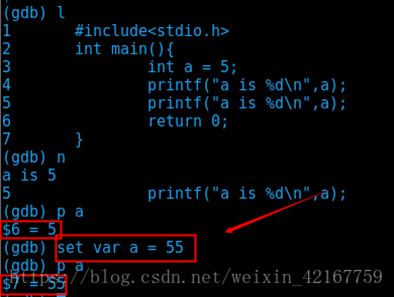
3.20 set var - 调试的过程中改变变量的值
调试过程中,改变运行时函数的参数值:
| set var a=5 #临时将变量a的值改为5 |

3.21 cd/pwd - 切换/查看工作目录
| (gdb) pwd Working directory /home/hupu/data/work/git/code/explore/kernel. (gdb) cd .. Working directory /home/hupu/data/work/git/code/explore. (gdb) |
3.22 指定gdb搜索源码的路径
在gdb程序的时候,有时候会发现使用list命令查看源代码时,提示源代码文件找不到,对于那些带调试信息的系统库或者第三方库,很多时候当你真正想gdb去追他源代码的时候你会发现gdb根本找不到这些源代码路径,这个时候有两种情况:
-
gdb中保留的是绝对路径
-
gdb中保留的是相对路径
3.22.1 set substitute-path - 适用于绝对路径,映射路径
如果gdb这个时候告诉你找不到这个带调试信息库的源文件路径,此时给出的路径地址是绝对路径,比如下面这种提示的,此时可以使用gdb提供的set substitute-path,这个其实就是替换规则,你如果想查看当前的替换规则
| /home/rickyk/qt-4.8./src/corelib/tools/qstring.cpp: 没有那个文件或目录 |
这种提示的,你就应该用gdb提供的set substitute-path,这个其实就是替换规则。比如此时我们需要qstring.cpp这个文件,但由于某种原因,目前我们不能在/home/rickyk/qt-4.8.6/src/corelib/tools/qstring.cpp中找到,但我们确可以在/home/rickyk/qt-everywhere-opensource-src-4.8.6/src/corelib/tools/qstring.cpp中找到,我们就
| set substitute-path /home/rickyk/qt-4.8. /home/rickyk/qt-everywhere-opensource-src-4.8. |
这是什么意思?其实就是让gdb在看到/home/rickyk/qt-4.8.6的时候他会做自动替换成/home/rickyk/qt-everywhere-opensource-src.4.8.6,也就是说gdb可以正确知道这个文件了。此时我们再show substitute-path可以看到此时的转换规则已经被我们加进去了
| (gdb) show substitute-path List of all source path substitution rules: `/home/rickyk/qt-4.8.' -> `/home/rickyk/qt-everywhere-opensource-src-4.8.6'. |
gcc加上-g编译的时候,记录的是绝对路径,如果后来你的代码的路径变化了,则在gdb调试的时候使用list查看源代码的时候会提示找不到源文件,当然最简单的方法就是你将源代码放回到原来的目录下,此外,你也可以通过设置substitute-path的方式修改gdb的源码搜索路径的方式解决,也就是把源码绝对路径里面的一个path映射到另一个path上去,
| set substitute-path <from_path> <to_path> #将 show substitute-path #查看设置是否生效 unset substitute-path #取消设置 |
比如list显示的源码是/home/aaa/1.cpp
那么设置了 set substitute-path /home/aaa/ /home/bbb/
之后,即使你的源文件1.cpp放在/home/bbb下面也是可以找到的了,因为gdb帮你做了字符串替换
3.22.2 directory - 适用于相对路径,指定源码搜索路径
如果此时的gdb弹出的错误信息不是绝对路径的概念,而是相对路径的概念,例如
| ./a.cpp 没有那个文件或目录 |
那么此时你可以用dir命令来指定,如果我们此时的a.cpp不在当前目录下,而是在当前目录下的bak文件夹下,我们只要执行下面的命令,这个时候我们的gdb就会把你加进去的dir整个替换到相对路径的前面,自己做拼接,也就是说,现在的./a.cpp变成了./bak/a.cpp。
| dir bak |
注意两者的差别,对于绝对路径来说,你需要给出替换规则给他做字符串替换,对于相对路径来说,你需要给他目录来让他做拼接,也有点prefix的意思,这里的prefix由你给出,但相对路径整体结构由gdb给出,然后完成拼接操作。
| dir # 不接路径的话表示清除当前的设置 dir <your-source-dir> # 指定你的源码保存的路径,需要指定多个路径时, # UNIX下使用":"隔开,Windows下使用";"隔开 show dir # 查看当前设置的dir有哪些 |
3.23 shell - 执行shell命令
| shell cmd # 执行shell命令,例如shell ls |
3.24 quit - 退出调试环境
| q/quit #显示各类详细 |
3.25 使用"::"符号,指定要关注的变量或函数的所处位置
当程序中包含多个作用域不同但名称相同的变量或表达式时,可以借助::运算符明确指定要查看的目标变量或表达式。::运算符的语法格式如下:
其中 file 用于指定具体的文件名,funciton 用于指定具体所在函数的函数名,variable 表示要查看的目标变量或表达式。
| (gdb) print file::variable (gdb) print function::variable |
举个例子:
| 01 #include <stdio.h> 02 int num = 10; 03 int main(){ 04 int num = 20; 05 return 0; 06} |
假设该程序存储在 main.c 文件中,则使用 GDB 调试至第 5 行(return 0)处暂停后,通过执行如下命令,即可查看 num 全局变量的值:
| (gdb) print 'main.c'::num $1 = 10 |
而通过执行如下命令,可以查看 num 局部变量的值:
| (gdb) p main::num $1 = 20 |
当然,由于 GDB 调试就暂停在 main() 函数中,因此即便不指明main::,这里的 num 默认指代的也是 num 局部变量。
四、使用gdb调试正在运行的程序
调试已经运行的程序有两种方法:
在Linux下用ps查看正在运行的程序的PID,然后用gdb PID格式挂接正在运行的程序。
先用gdb关联上源代码,并进行gdb,在gdb中用attach命令来挂接进程的PID,并用detach来取消挂接的进程。
未完待续...

文章评论
crazy?
牛逼思密达